Aggregate cell counts by any two metadata fields and draw an alluvial plot
with plot_alluvial. Extra arguments are passed straight to
plot_alluvial().
Arguments
- obj
A Seurat object.
- group_col
Metadata field mapped to the x-axis (e.g. sample, time).
- cluster_col
Metadata field defining strata (e.g. cell type / ident).
- return
return a plot (set "plot") or a list with plot and data (set "both").
- ...
Additional arguments forwarded to
plot_alluvial().
Examples
library(Seurat)
data("pbmc_small")
pbmc_small$Group <- pbmc_small$orig.ident # mock group
pbmc_small$Cluster <- Idents(pbmc_small) # use idents
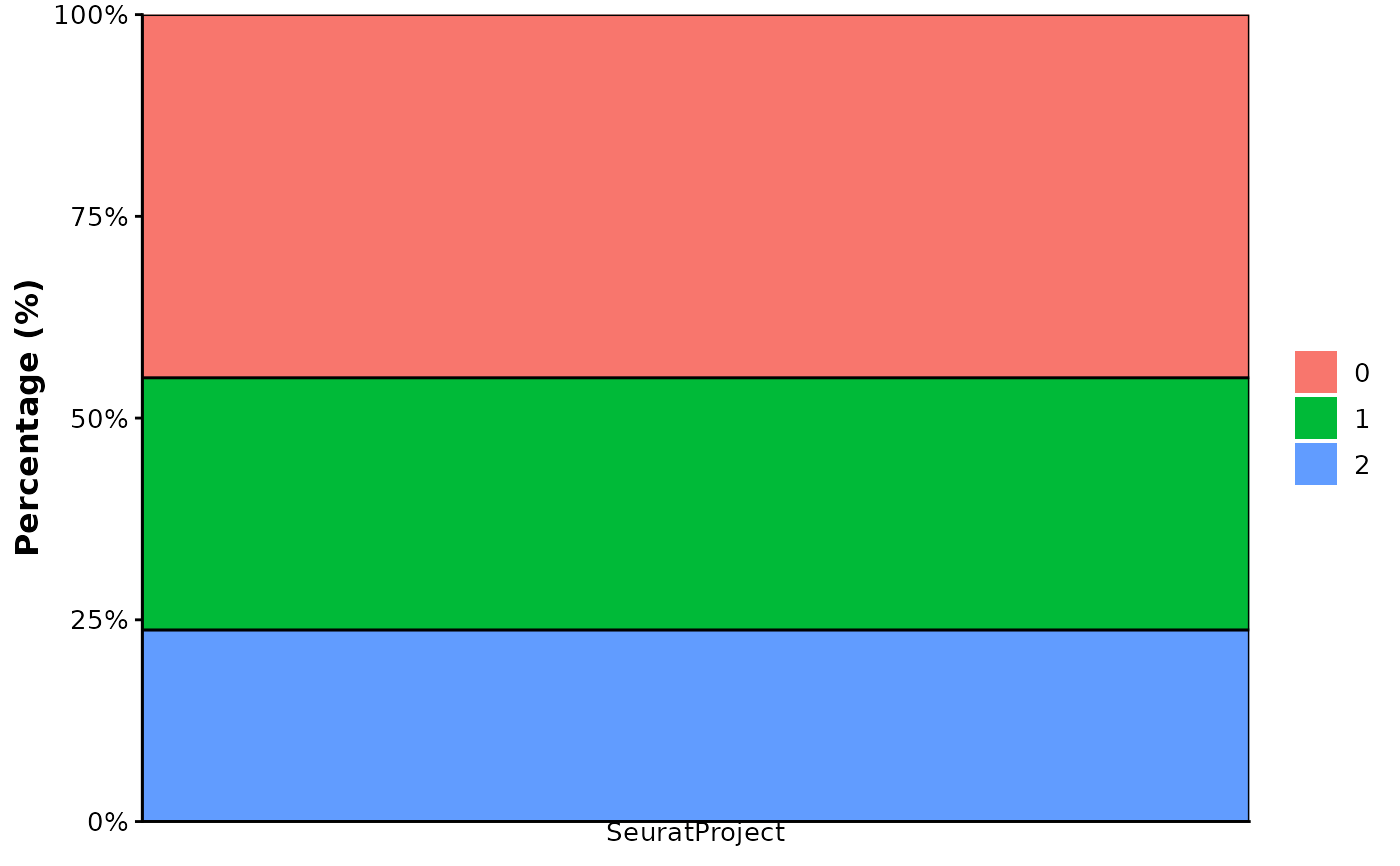
## default colours
plot_alluvial_sc(pbmc_small)
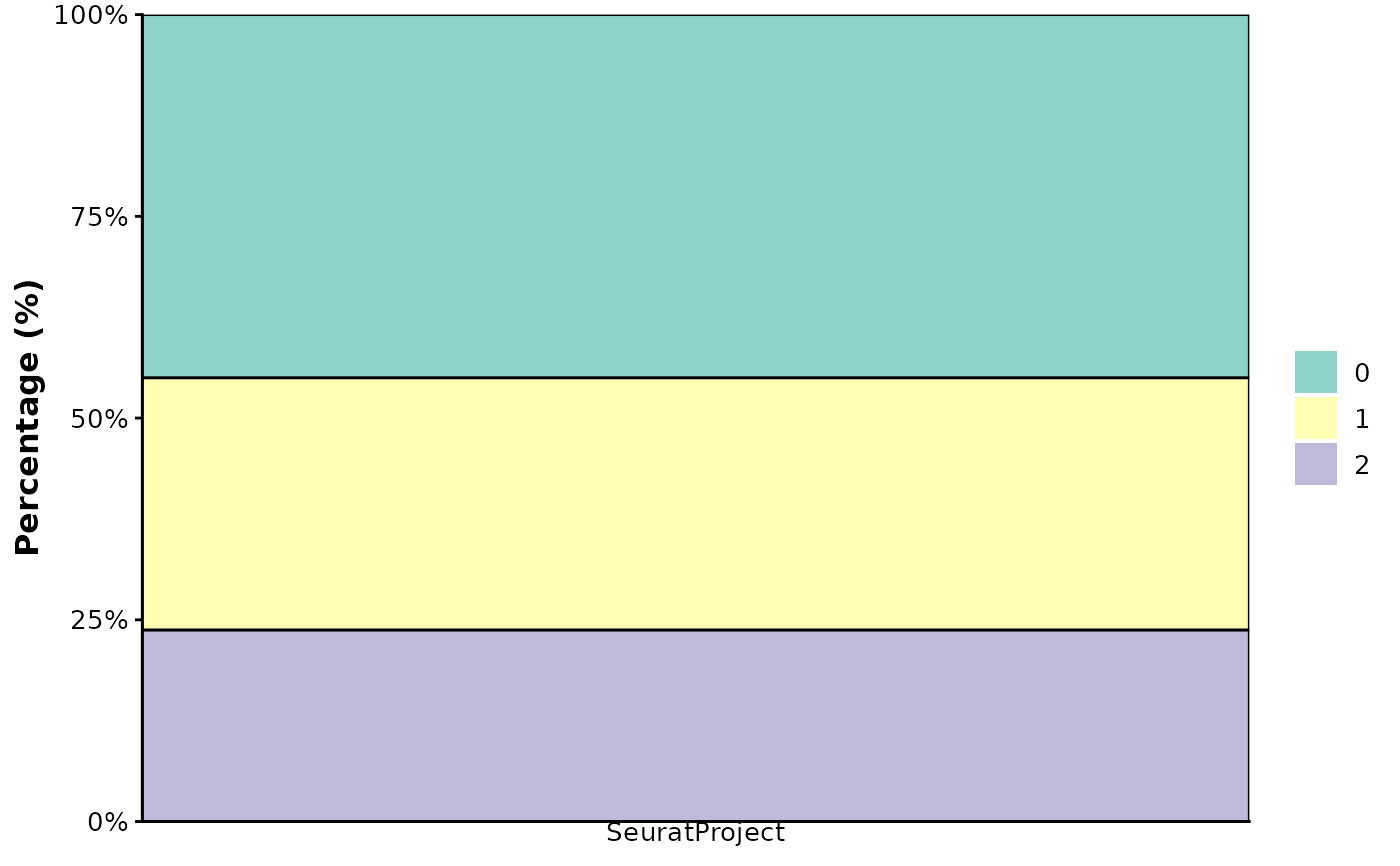
 ## custom palette (unnamed)
plot_alluvial_sc(
pbmc_small,
palette = c("#8DD3C7","#FFFFB3","#BEBADA","#FB8072",
"#80B1D3","#FDB462","#B3DE69"))
## custom palette (unnamed)
plot_alluvial_sc(
pbmc_small,
palette = c("#8DD3C7","#FFFFB3","#BEBADA","#FB8072",
"#80B1D3","#FDB462","#B3DE69"))